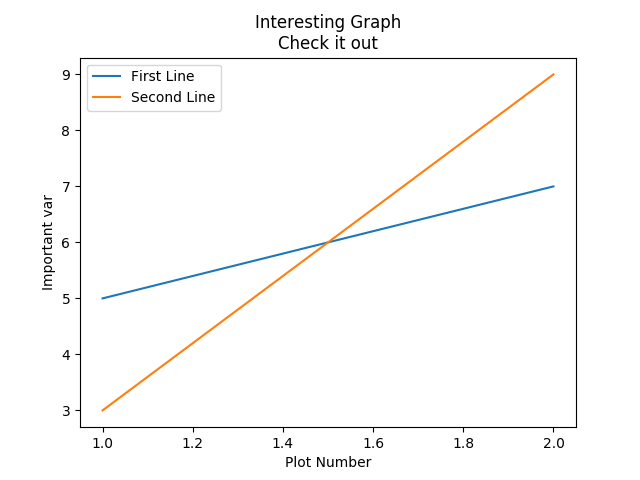
这里介绍如何设置坐标,坐标标题和标签
import matplotlib.pyplot as plt

x = [1,2]
y = [5,7]

x2 = [1,2]
y2 = [3,9]

plt.plot(x, y, label='First Line')    # 画直线,打标签
plt.plot(x2, y2, label='Second Line')

plt.xlabel('Plot Number')        # X轴标签
plt.ylabel('Important var')      # Y轴标签
plt.title('Interesting Graph\nCheck it out')  # 图的描述
plt.legend()                 # 画出带"label"的图例
plt.show()
| 函数名 | 作用 |
|---|---|
| title | 图标的标题 |
| xlabel | x轴的名称 |
| ylabel | y轴的名称 |
| legend | 显示右上角的图例 |
| grid | 显示网格 |
| show | 显示图像 |
Source: http://blog.csdn.net/wizardforcel/article/details/54407212