Logistic概率分布函数和密度函数
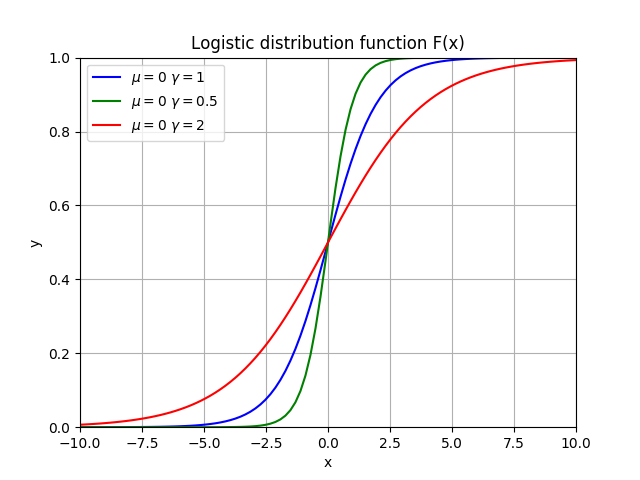
概率分布函数:
import matplotlib.pyplot as plt
import numpy as np

X1 = np.linspace(-10, 10, 100,endpoint=True)
u = 0
r = 1.
Y1 = 1./(1+np.exp(-(X1-u)/r))

plt.plot(X1,Y1, label=r'$ \mu=0\  \gamma=1 $', color='b')

u = 0
r = 0.5
Y2 = 1./(1+np.exp(-(X1-u)/r))
plt.plot(X1,Y2, label=r'$ \mu=0\  \gamma=0.5 $', color='g')

u = 0
r = 2
Y3 = 1./(1+np.exp(-(X1-u)/r))
plt.plot(X1,Y3, label=r'$ \mu=0\  \gamma=2 $', color='r')

plt.axis([-10, 10, 0, 1])
plt.xlabel('x')
plt.ylabel('y')
plt.grid(True)
plt.title('Logistic distribution function F(x)')
plt.legend()
plt.show()
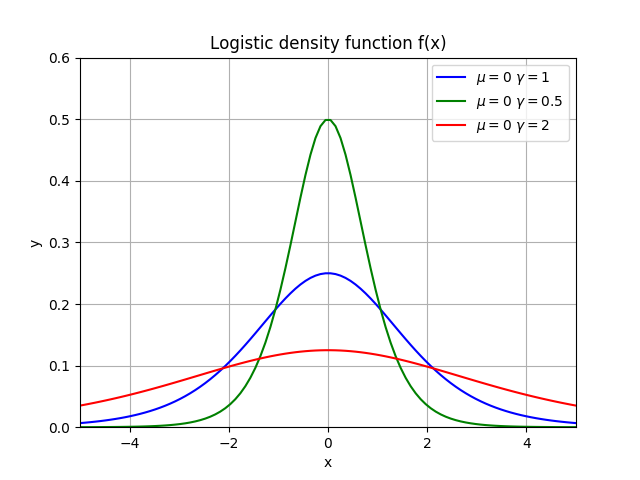
概率密度函数:
import matplotlib.pyplot as plt
import numpy as np

X1 = np.linspace(-5, 5, 100,endpoint=True)
u = 0
r = 1.
Y1 = np.exp(-(X1-u)/r)/(r* np.square(1+np.exp(-(X1-u)/r)))

plt.plot(X1,Y1, label=r'$ \mu=0\  \gamma=1 $', color='b')

#X1 = np.linspace(-5, 5, 50,endpoint=True)
u = 0
r = 0.5
Y2 = np.exp(-(X1-u)/r)/(r* np.square(1+np.exp(-(X1-u)/r)))
plt.plot(X1,Y2, label=r'$ \mu=0\  \gamma=0.5 $', color='g')

u = 0
r = 2
Y3 = np.exp(-(X1-u)/r)/(r* np.square(1+np.exp(-(X1-u)/r)))
plt.plot(X1,Y3, label=r'$ \mu=0\  \gamma=2 $', color='r')

plt.axis([-5, 5, 0, 0.6])
plt.xlabel('x')
plt.ylabel('y')
plt.grid(True)
plt.title('Logistic density function f(x)')
plt.legend()
plt.show()